Gold has captured investors’ attention for decades as both a store of value and a portfolio diversifier. Many people wonder whether this precious metal has delivered solid returns over time, especially during periods of economic uncertainty and market volatility.
So if you wondered about the average return of gold in last 30 years, you’re at the right place.

Over the past 30 years, gold has generated average annual returns of approximately 6-7%, though this performance varies significantly depending on the specific time period measured. This return places gold above most inflation rates but below the stock market’s long-term average. Gold’s best year during this period was 2007, when it delivered a 30.8% return, while some years like 2015 and 2018 saw negative performance.
Understanding gold’s historical performance requires looking beyond simple return numbers. You’ll discover how gold compares to stocks and bonds, why inflation affects its value, and what factors drive its price movements. This analysis will help you determine whether gold deserves a place in your investment strategy and how much exposure might make sense for your financial goals.
Average Return of Gold In Last 30 Years
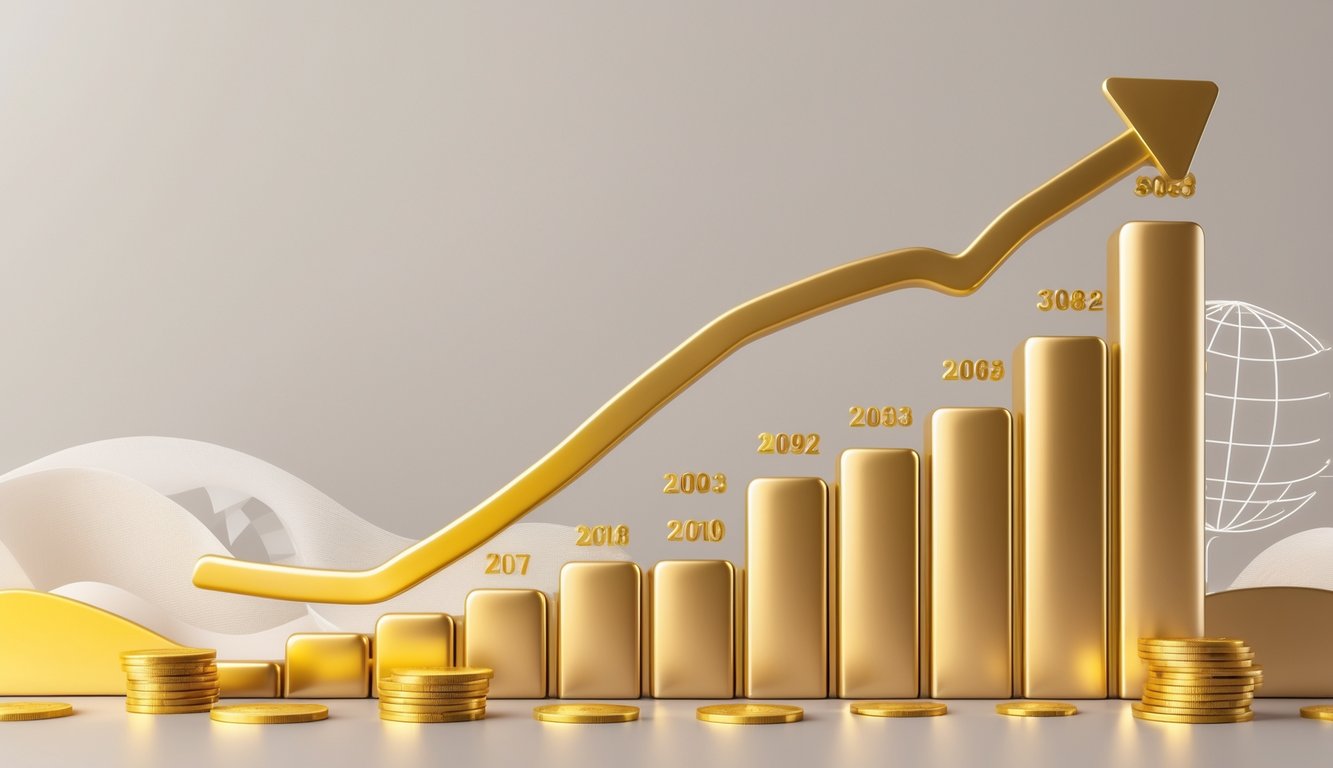
Gold has delivered an average annual return of approximately 6-7% over the past three decades. The precious metal experienced its strongest performance in 2007 with a 30.8% return, while showing significant decade-by-decade variations in performance patterns.
Annual Return Trends
Gold’s annual returns have shown considerable volatility throughout the 30-year period. Your investment returns would have varied dramatically from year to year, with some periods delivering exceptional gains while others resulted in losses.
The precious metal demonstrated negative correlation with traditional assets during market stress. When stocks fell sharply, gold often provided positive returns that helped protect your portfolio value.
Interest rates and inflation played major roles in driving gold’s annual performance. Lower interest rates typically boosted gold returns because you faced less opportunity cost holding non-yielding assets.
Economic uncertainty consistently drove gold’s strongest annual performances. During financial crises, currency devaluations, and geopolitical tensions, you would have seen gold deliver some of its best yearly results.
Decade-by-Decade Performance
The 1990s marked a challenging period for gold investors. Gold price remained relatively stagnant as strong economic growth and low inflation reduced demand for safe-haven assets.
The 2000s represented gold’s strongest decade in the 30-year span. You would have seen gold prices rise from around $270 per ounce to over $1,100 by decade’s end. The dot-com crash and 2008 financial crisis drove massive inflows into gold.
The 2010s started strong but showed mixed results overall. Gold reached nearly $1,900 per ounce in 2011 before entering a consolidation phase. Your returns during this decade would have depended heavily on your entry and exit timing.
The current decade began with renewed strength. COVID-19 drove gold to new all-time highs above $2,000 per ounce in 2020.
Best and Worst Years for Gold
Gold achieved its best single-year performance in 2007, delivering a remarkable 30.8% return. This exceptional year occurred as financial markets began showing stress ahead of the 2008 crisis.
Other standout years included periods around major economic disruptions. You would have seen strong double-digit returns during the early 2000s recession and again during the 2008-2011 financial crisis period.
Gold’s worst years typically coincided with rising interest rates and strong economic growth. During these periods, you might have experienced negative returns as investors shifted toward yield-producing assets.
The precious metal showed particular weakness during the mid-2010s when the Federal Reserve began raising rates. Your gold holdings would have faced headwinds as the dollar strengthened and economic conditions improved.
Long-term returns smoothed out much of this annual volatility, providing more consistent wealth preservation over extended holding periods.
Comparison of Gold With Other Asset Classes
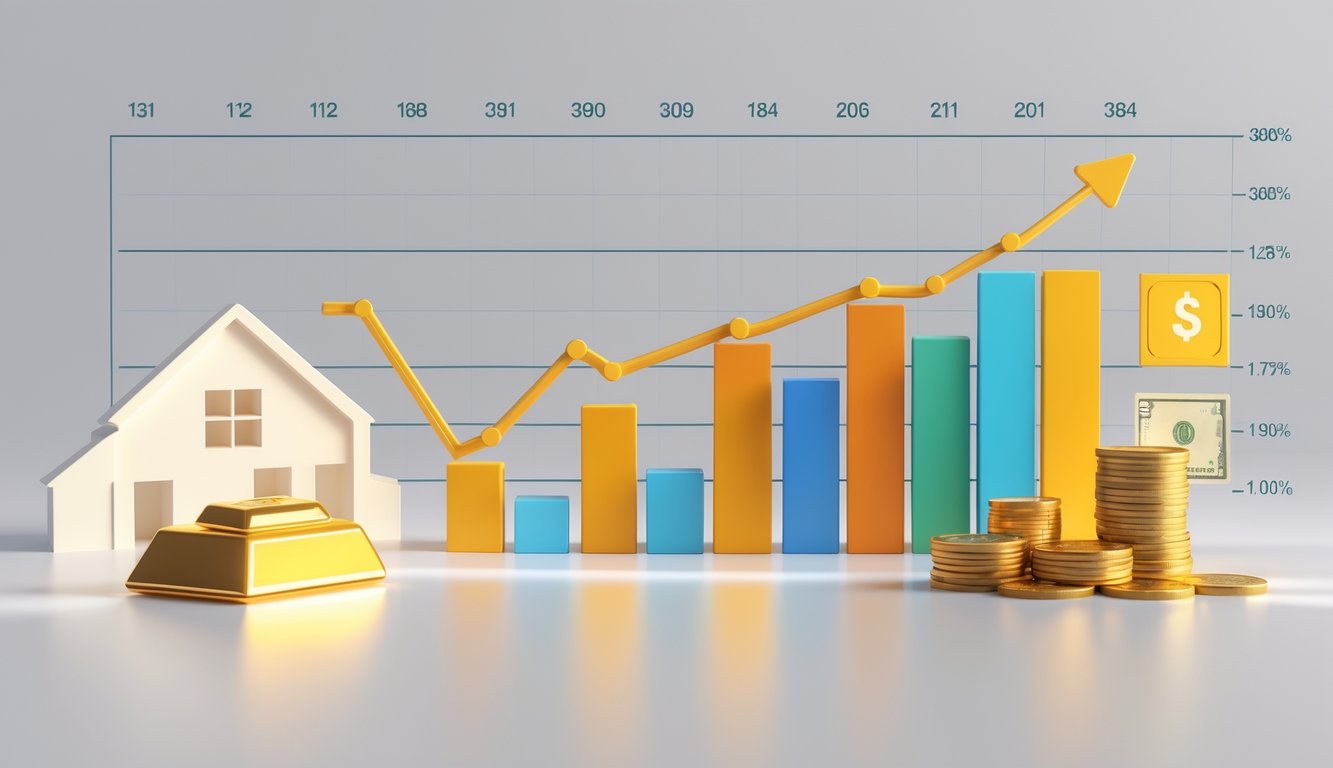
Gold’s long-term returns differ significantly from stocks and bonds over the past 30 years. While stocks have delivered higher returns during bull markets, gold has provided better protection during economic downturns and maintained steady performance as a portfolio diversifier.
Gold vs Stocks Returns
Your gold investments have delivered approximately 6-7% annual returns over the past three decades. This places gold well behind the stock market’s performance during the same period.
The S&P 500 has averaged around 10.5% annually since 1995. This means your stock investments would have grown significantly faster than gold during most time periods.
However, gold shines during market crises. During the 2008 financial crisis, gold gained 5.8% while stocks dropped 38.5%. In March 2020, gold held steady as stocks plummeted over 30%.
Gold and stocks often move in opposite directions. This negative correlation makes gold valuable for your portfolio diversification strategy.
Your timing matters greatly with these asset classes. From 2009-2019, stocks delivered 235% total returns compared to gold’s 49%. But during the 2000-2002 dot-com crash, gold gained 12.4% while stocks fell 49.1%.
Gold vs Bonds Performance
Your bond investments have provided more modest returns than gold over the long term. Since 1995, 10-year Treasury bonds have averaged approximately 4.8% annually compared to gold’s 6% returns.
Gold performs better than bonds during inflationary periods. When inflation rises above 3%, your gold holdings typically gain value while bond prices decline.
Interest rates drive the relationship between these asset classes. When rates fall, both gold and bonds can benefit. But gold offers better protection against currency devaluation.
Your bond investments provide regular income through interest payments. Gold produces no income, relying solely on price appreciation for returns.
During the past 30 years, gold has outperformed bonds by roughly 1.2% annually. This gap widens significantly during periods of economic uncertainty or rising inflation expectations.
Impact of Inflation on Gold Returns
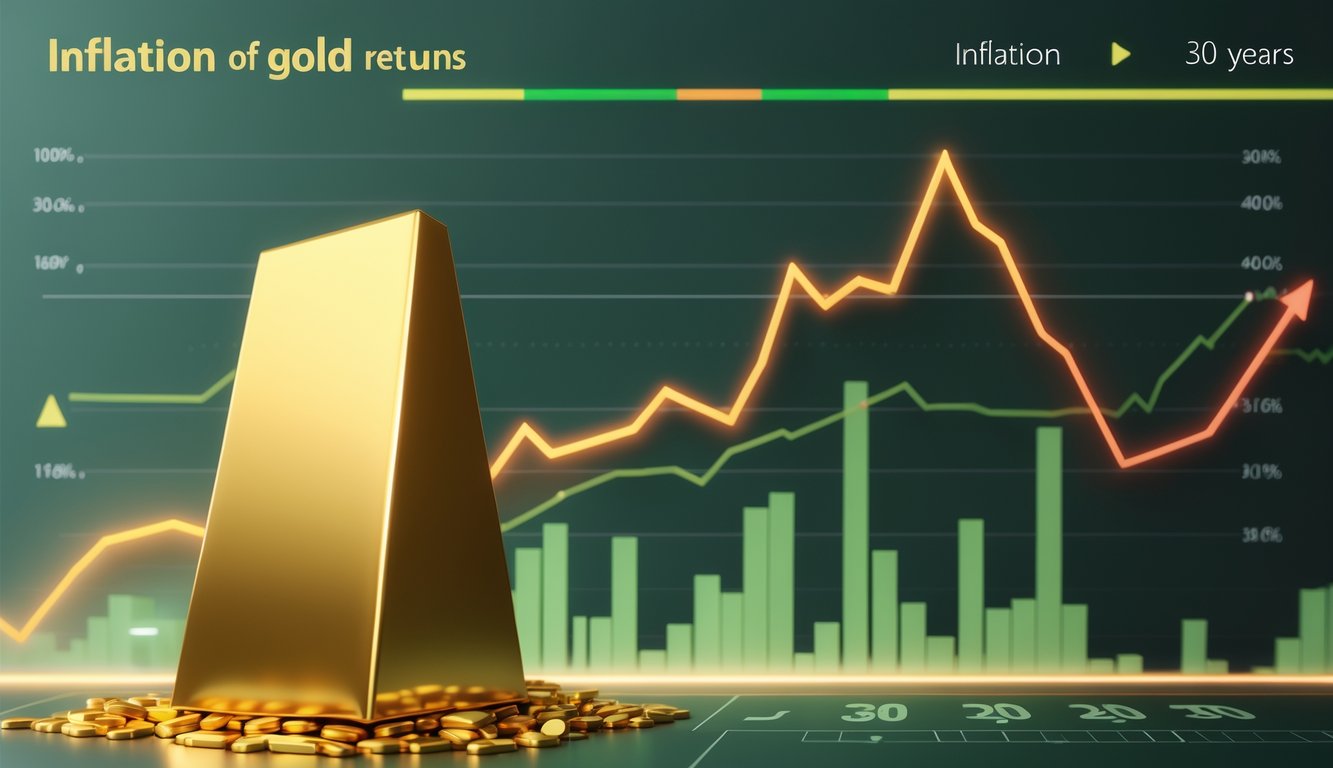
Inflation significantly affects gold’s real purchasing power over time, reducing its actual returns when prices rise. Gold’s reputation as an inflation hedge has mixed historical evidence, with performance varying greatly across different time periods.
Inflation-Adjusted Gold Returns
When you adjust gold returns for inflation, the numbers tell a different story than nominal gains. From 1984 through 2024, gold generated an annualized return of 4.3% before inflation.
After adjusting for inflation, gold’s real return dropped to just 1.5% annually. This means your purchasing power barely increased over this 40-year period.
The 30-year picture shows slightly better results. From 1994 through 2024, gold delivered 5.7% nominal returns annually. When adjusted for inflation, this fell to 3.1% per year.
Gold’s real returns vary dramatically by time period:
- 40-year period (1984-2024): 1.5% annually
- 30-year period (1994-2024): 3.1% annually
- 20-year period (2004-2024): 5.6% annually
The shorter time frames show better inflation-adjusted performance. This reflects gold’s strong run in the early 2000s during financial crises.
Gold as an Inflation Hedge
Gold’s track record as an inflation hedge is inconsistent and often disappointing. From 1987 to 2001, gold prices actually dropped while inflation stayed around 3% annually.
Gold performs differently during various inflation scenarios:
- High inflation periods: Gold can soar during extreme inflation like the 1970s-1980s
- Moderate inflation: Often fails to keep pace with rising prices
- Low inflation: May decline in value during prosperous economic times
The 2022 example highlights this inconsistency. Despite inflation hitting 40-year highs in the U.S., gold prices ended the year essentially unchanged.
Research shows gold returned 15% annually during high inflation periods over 50 years. However, during moderate inflation, your gold investments may struggle to maintain purchasing power.
Treasury Inflation-Protected Securities (TIPS) offer guaranteed inflation protection that gold cannot match consistently.
Gold in Investment Portfolios
Gold provides portfolio balance through its unique market behavior that often moves independently from stocks and bonds. Most financial advisors recommend allocating 5-10% of your portfolio to gold as protection against market volatility.
Role in Diversification
Gold typically shows a negative correlation with traditional assets like stocks. During the 2008 financial crisis, gold prices rose 25% while the S&P 500 fell 38%. This counter-cyclical movement makes gold valuable for reducing overall portfolio risk.
Your diversification benefits increase because gold often maintains value when other investments decline. The precious metal showed a correlation of approximately -0.2 with the S&P 500 during 1990-2020.
Gold performs particularly well during market stress periods:
- 2000-2002 dot-com crash: Gold gained 12.4% while S&P 500 lost 49.1%
- 2008 financial crisis: Gold rose 5.8% while S&P 500 dropped 38.5%
- 2020 COVID-19: Gold surged 25.1% during initial market panic
You can add gold exposure through physical gold, ETFs, mining stocks, or mutual funds. Each method offers different risk levels and convenience factors.
Portfolio Allocation Strategies
Conservative approach: Allocate 5% of your portfolio to gold for basic protection. This amount provides diversification benefits without overwhelming your other investments.
Moderate approach: Use 7-10% allocation during uncertain economic times. You can adjust this percentage based on inflation expectations and interest rate trends.
Tactical allocation: Increase gold holdings when these conditions exist:
- Rising inflation above 3%
- Declining real interest rates
- Increasing geopolitical tensions
- Weakening U.S. dollar
You should rebalance your gold allocation annually. When gold outperforms, sell some to maintain your target percentage. When gold underperforms, add more to keep proper balance.
Dollar-cost averaging works well for gold investments. Buy fixed amounts monthly regardless of price to reduce timing risk.
Factors Influencing Gold Performance
Gold prices respond to several key economic forces that shape its returns over time. Macroeconomic conditions like inflation and interest rates create the foundation for gold’s performance, while geopolitical tensions and central bank decisions add volatility and directional movement to prices.
Macroeconomic Conditions
Inflation stands as the most important factor driving gold performance over the long term. When inflation rises above 3%, gold typically gains an average of 15.8% annually as investors seek protection from declining currency values.
Interest rates move in the opposite direction of gold prices. Lower interest rates reduce the opportunity cost of holding gold since it doesn’t pay dividends or interest. During periods of near-zero rates, like after 2008 and 2020, gold reached historic highs.
The U.S. dollar’s strength directly impacts gold prices. A weaker dollar makes gold cheaper for foreign buyers, increasing demand and pushing prices higher. This negative correlation explains why gold often rises during currency devaluation periods.
Economic uncertainty drives investors toward gold as a safe haven. During recessions, market volatility, or financial crises, gold typically outperforms other assets as people seek stability.
Geopolitical Events
Major global conflicts and political tensions create immediate spikes in gold demand. Wars, trade disputes, and international crises push investors toward gold as protection against uncertainty.
The Iraq War and tensions with North Korea historically caused significant gold price increases. These events create fear in financial markets, making gold’s stability more attractive to investors.
Supply chain disruptions from global events affect gold mining and distribution. Natural disasters, labor strikes, or political instability in major gold-producing countries can reduce supply and increase prices.
Election cycles and government changes also influence gold prices. Policy uncertainty during transitions often leads to increased gold buying as investors hedge against potential economic changes.
Central Bank Policies
Federal Reserve monetary policy decisions significantly impact gold performance. Quantitative easing programs typically boost gold prices by increasing money supply and reducing real interest rates.
Central bank gold purchases affect market dynamics. When banks increase their gold reserves, it removes supply from the market and can drive prices higher. Global central banks added significant gold holdings during the 2010s.
Policy announcements about future interest rate changes create immediate gold price movements. Even hints about rate changes can cause substantial price swings as traders adjust positions.
Emergency monetary measures during crises often benefit gold. The unprecedented stimulus measures during COVID-19 helped push gold to record highs above $2,000 per ounce.
Alternative Investments to Gold
While gold has averaged 6-7% annual returns over the past 30 years, investors seeking similar portfolio benefits can explore other asset classes that offer hedge characteristics or store-of-value properties.
Bitcoin as Digital Gold
Bitcoin has emerged as a popular alternative to traditional gold investing. Many investors now view it as “digital gold” because of its limited supply and potential inflation hedge properties.
Bitcoin’s price volatility far exceeds gold’s movements. While gold typically fluctuates 15-20% annually, Bitcoin can swing 50-80% in a single year. This creates both higher profit potential and greater risk.
The cryptocurrency offers several advantages over physical gold. You can buy Bitcoin instantly through online exchanges. Storage costs are minimal compared to gold’s insurance and vault fees.
Key differences include:
- Accessibility: Bitcoin trades 24/7 versus gold’s market hours
- Divisibility: You can buy fractional Bitcoin amounts easily
- Portability: Digital storage versus physical storage needs
Bitcoin’s correlation with traditional assets changes during market stress. Sometimes it moves with stocks rather than acting as a safe haven like gold does.
Gold in Jewelry and Industrial Uses
Gold jewelry represents the largest source of gold demand worldwide. This market creates steady baseline demand that supports gold prices during economic downturns.
Industrial applications for gold continue growing in electronics and medical devices. These uses provide fundamental value beyond investment speculation. Gold’s conductivity and resistance to corrosion make it essential in many technologies.
Investment approaches include:
- Collectible jewelry pieces that appreciate over time
- Gold mining stocks that benefit from industrial demand
- ETFs focused on gold-using companies
Jewelry demand varies by culture and economic conditions. Asian markets traditionally drive higher jewelry consumption than Western countries. This geographic diversification helps stabilize overall gold demand even when investment buying fluctuates.
Frequently Asked Questions
Gold’s 6-7% average annual return over 30 years raises common questions about performance comparisons, influencing factors, and investment calculations. Understanding these details helps you make informed decisions about gold’s role in your portfolio.
What has been the historical performance of gold as an investment over the past three decades?
Gold has delivered an average annual return of approximately 6-7% over the last 30 years. This performance places it above inflation rates but below stock market returns.
The metal started around $270 per ounce in 2000 and reached over $2,000 per ounce by 2020. Your investment would have grown by roughly 330% over this three-decade period.
Gold showed its strongest performance during economic crises. During the 2008 financial crisis, gold gained 24% while stocks fell 38%.
The precious metal hit historic highs of nearly $1,900 per ounce in 2011. It later consolidated between $1,050 and $1,350 from 2013 to 2019 before climbing again.
How has gold’s average annual return compared to that of the stock market in the last 20 years?
Gold has underperformed the stock market over the past two decades. Since 1995, gold returned about 6% annually while the S&P 500 averaged 10.5% annual returns.
During strong bull markets, this gap widens significantly. From 2009-2019, the S&P 500 delivered 235% total returns compared to gold’s 49%.
However, gold often moves opposite to stocks during market stress. When stocks crash, gold typically holds steady or gains value.
The correlation between gold and stocks is generally negative or close to zero. This makes gold valuable for balancing your portfolio during volatile periods.
What factors have influenced gold’s return rates over the past 30 years?
Interest rates significantly impact gold prices. When rates fall, gold becomes more attractive since it doesn’t pay interest itself.
Inflation drives gold demand as a hedge against currency devaluation. Gold gained an average of 15.8% during years when inflation exceeded the Federal Reserve’s 2% target.
Economic uncertainty and geopolitical tensions boost gold prices. Major events like the Iraq War and banking crises have historically caused price spikes.
The U.S. dollar’s strength affects gold inversely. When the dollar weakens, gold typically strengthens since it’s priced in dollars globally.
How can investors calculate the return on gold investment for a specified period?
You calculate gold returns using the compound annual growth rate (CAGR) formula. CAGR equals (Ending Value/Beginning Value) raised to the power of (1/number of years), then subtract 1.
For example, if you bought gold at $300 per ounce and sold at $600 after 10 years, your CAGR would be 7.2%. This accounts for compounding effects over time.
Remember to subtract storage costs from your returns. Physical gold storage typically costs 0.5-1.5% annually, while gold ETFs charge expense ratios of 0.25-0.40%.
Time periods matter greatly when measuring performance. Your 10-year return may differ significantly from 30-year returns due to different starting and ending points.
What are the risks and benefits of including gold in a long-term investment portfolio?
Gold provides portfolio diversification since it often moves independently from stocks and bonds. Financial advisors typically recommend allocating 5-10% of your portfolio to gold.
The main benefit is protection during market downturns. Gold maintained or gained value during major crises like 2008 and 2020 when other assets declined.
However, gold doesn’t produce income through dividends or interest. Your returns come solely from price appreciation, unlike stocks or real estate.
Storage and insurance costs reduce your effective returns. You’ll also face liquidity considerations if you own physical gold versus ETFs.
Has the gold market shown a consistent growth pattern in the last three decades?
Gold has not shown consistent growth but rather moves in long-term cycles. Bull markets can last several years, followed by periods of consolidation or decline.
The metal experienced major bull runs from 2000-2011 and again from 2019-2020. Between these periods, prices often moved sideways or declined.
Gold’s volatility averages 15.2% annually, meaning significant year-to-year price swings are normal. Some years saw gains exceeding 25% while others showed losses over 10%.
Despite volatility, the long-term trend has been upward. Gold’s cumulative 30-year return of approximately 360% demonstrates its value as a long-term store of wealth.


